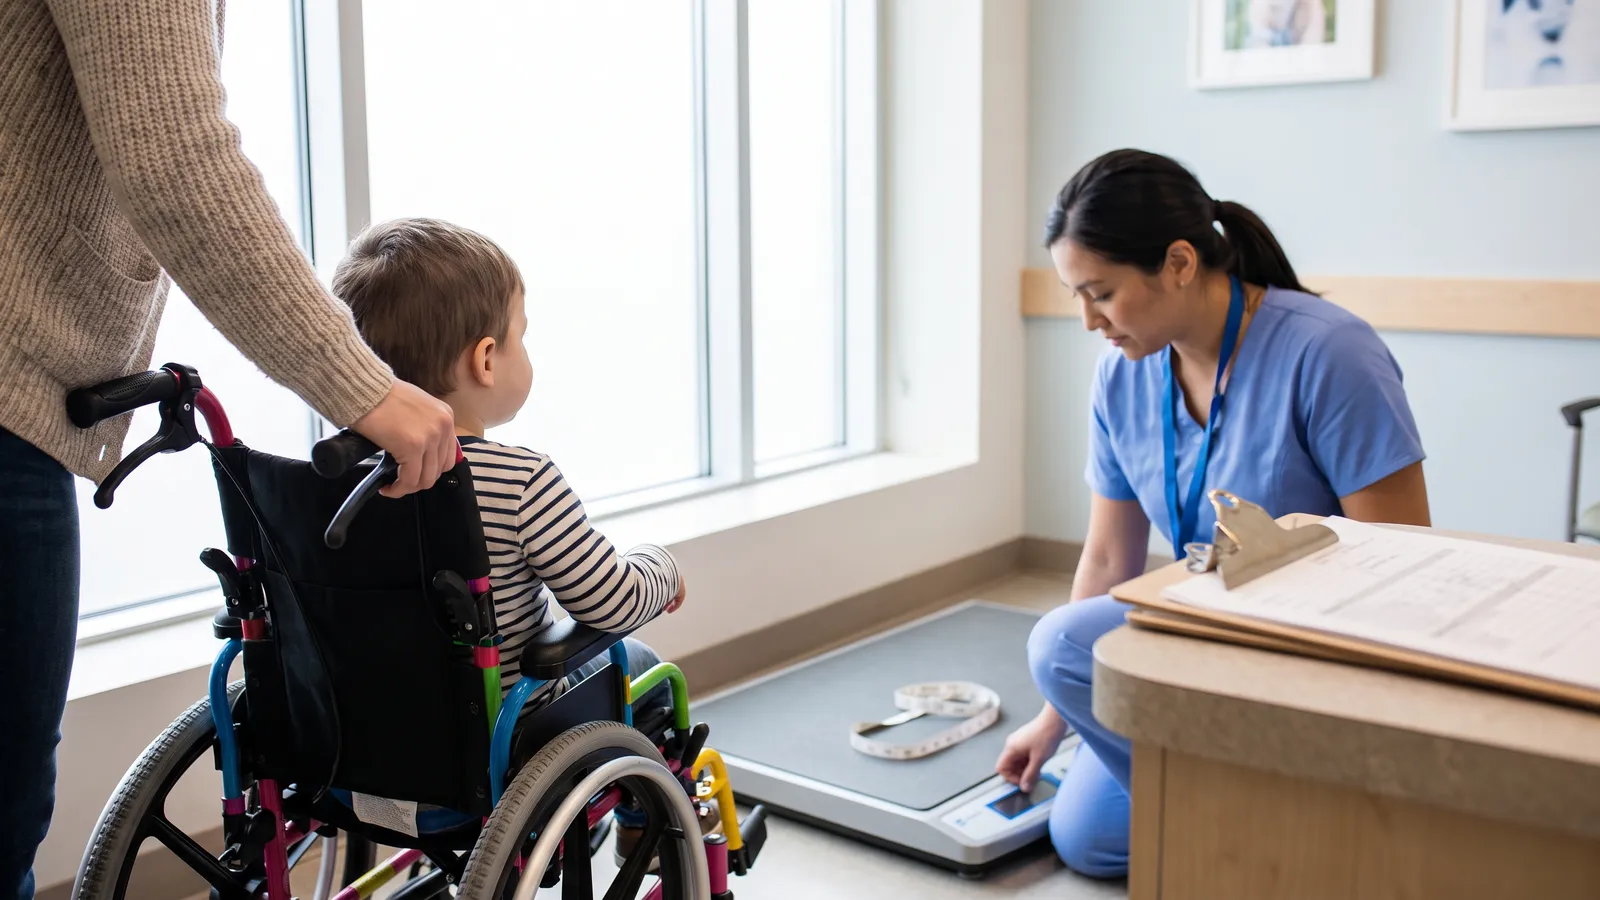
On the morning of September 28, 2026, the American Academy for Cerebral Palsy and Developmental Medicine gave its Presidential Guest Lecture in Philadelphia to one subject: how children with cerebral palsy grow. The speaker, Richard Stevenson, MD, of the University of Virginia, led the North American Growth in Cerebral Palsy Project, an NIH funded study of growth and health in children with CP.
Two studies published earlier in 2026 asked the question many parents bring to every checkup. Is my child underweight, or just small for a child at their level of CP? The answer depends on which growth chart is on the screen, and the two main options can sit far apart.
“Nutritional risk assessment appears to be method- and reference-dependent, supporting a multidimensional anthropometric approach in clinical practice.”
— Nutritional Neuroscience, May 2026
Two charts, two questions
A CDC chart compares a child with typically developing children of the same age and sex. The CP growth charts, published in Pediatrics in 2011 by Jordan Brooks, Steven Day, Robert Shavelle and David Strauss, compare a child with other children who have CP, of the same sex and the same GMFCS level. GMFCS, the Gross Motor Function Classification System, runs from level I (walks without limits) to level V (moves mainly in a wheelchair pushed by someone else). Level V is split again into tube fed and not tube fed.
The charts drew on 102,163 weights from 25,545 California children recorded from 1988 through 2002. In levels III to V, a weight below the 20th percentile on the CP chart came with a death rate 1.5 times that of heavier children at the same level. In levels I and II the line sat at the 5th percentile (hazard ratio 2.2). The charts show how children with CP did grow, not how they ideally should, so a 2017 European guideline (ESPGHAN) advised against using them alone to diagnose undernutrition.
What the 2026 studies found
In Clinical Nutrition ESPEN in July 2026, researchers in Argentina measured 809 children aged 2 to 20. On CDC charts, 49.6% had a weight z-score below -2, roughly the lowest 2% of typical children. Only 15.1% crossed the CP chart risk lines, mostly tube fed children at level V. In levels III to V, those risk lines matched CDC z-scores of about -4 to -5.
A study of 43 children aged 2 to 18 in Nutritional Neuroscience in May 2026 found undernutrition rates from 28% to 49%, depending only on which measure was used.
Why weight alone can mislead
Contractures and scoliosis make standing height hard to measure, so ESPGHAN recommends knee height or tibia (shin bone) length, taken with calipers. Weight also hides what the body is made of. A low BMI can mean little muscle rather than little fat, and in one study weight for height missed 45% of children with severely depleted fat stores. A triceps skinfold (a caliper pinch at the back of the upper arm) and mid-upper arm circumference fill that gap.
The guideline’s red flags are pressure sores or skin problems, poor circulation, a weight z-score below -2, skinfold or arm fat or muscle area below the 10th percentile, and weight that stalls or falls. It suggests measuring at least every 6 months.
Feeding and tubes
Swallowing trouble is common. One study cited by ESPGHAN found it in 99% of 166 children with neurological impairment. Coughing, a gurgly voice and wet breathing at meals are signs. The guideline suggests considering tube feeding when mealtimes total more than 3 hours a day. In a 12 month study of 57 children who received a gastrostomy (a feeding tube into the stomach), weight rose and feeding time fell, with no increase in chest infections. Our cerebral palsy diet guide covers feeding in more depth.
Questions for the care team
- Which chart is in my child’s record, and where does my child fall on each?
- Is my child’s GMFCS level current?
- How is height measured, and have skinfold or arm measurements been taken?
- Would a dietitian or a swallow study add anything right now?